

Management Reports · Intuit QuickBooks
Four tools for one report. Every period.
Management Reports · Intuit QuickBooks
More flexibility.
Less repeated effort.
The numbers, the narrative, the charts and the send-out now live in one report, built where the data already is.
Read the case study- Timeline
- Jul–Dec 2025
- Product
- QuickBooks Online
Advanced & Accountant - Role
- Senior product designer
Management Reports · Intuit QuickBooks
Four tools.
One report.
The numbers, the narrative, the charts and the send-out now live in one report, built where the data already is.
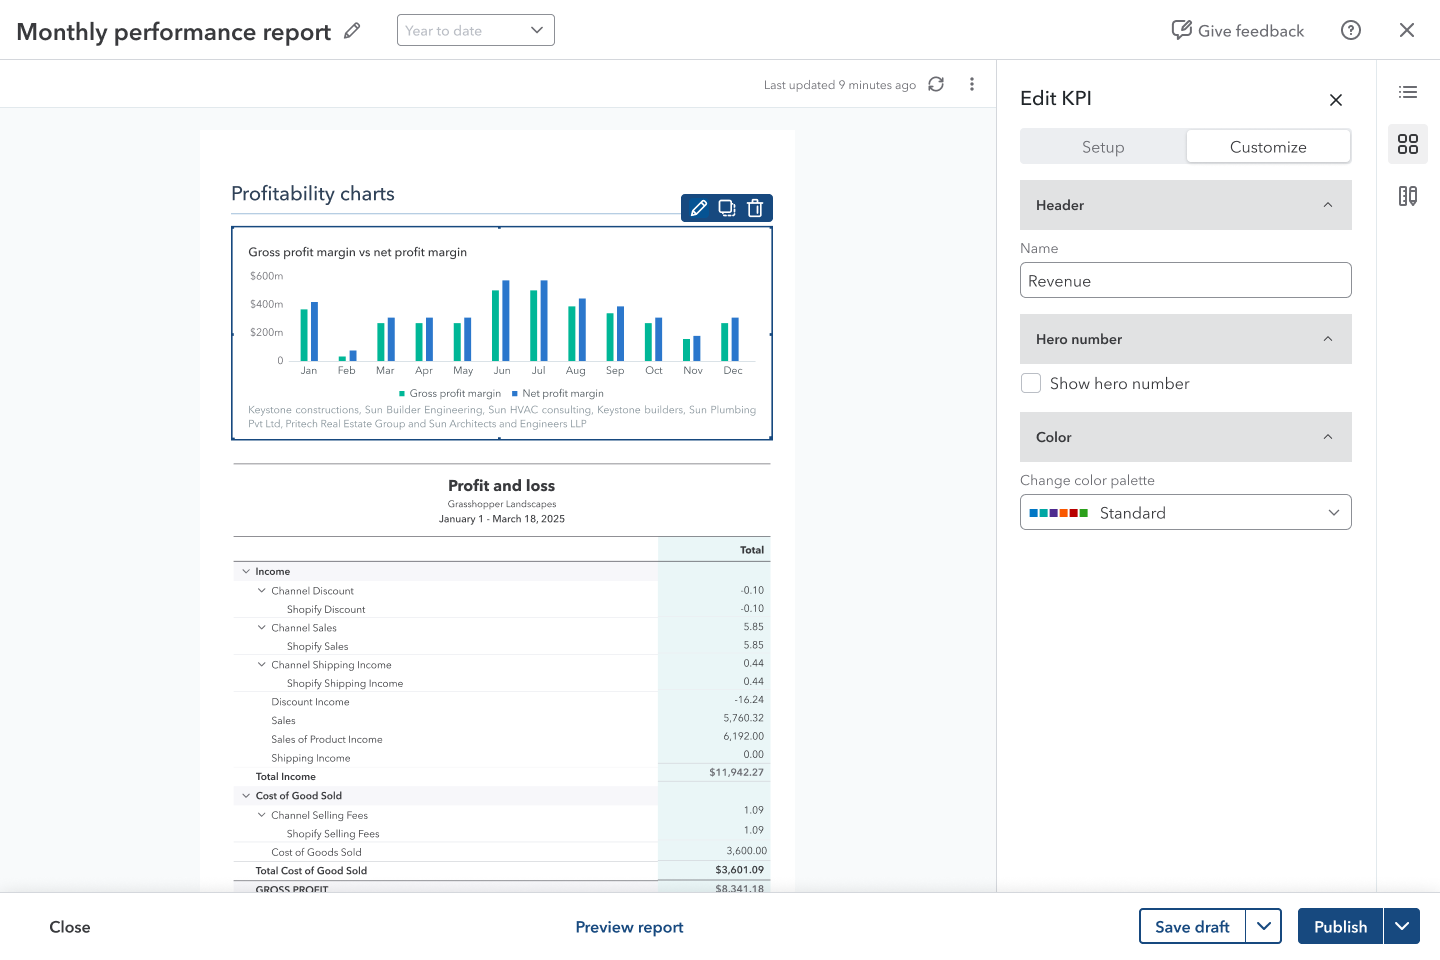
Jul–Dec 2025 · QuickBooks Online · Senior product designer
Read the case studyAt a glance
Compose, interpret and send a management report from one place.
Management Reports brought financial statements, KPIs, charts and written commentary into a single document editor, with the structure and styling carrying forward to the next period.
I carried the work from a broad brief to a shipped authoring system.
Turn a feature wish-list into one product model.
Problem framing + report lifecycle + capability map
Run research continuously, not in phases.
Rolling Follow-Me-Homes from vision to build, feeding each iteration
Define the authoring rules the system runs on.
Canvas architecture · time-period logic · reusable content blocks
Protect the core workflow and keep it consistent across the product.
Release sequencing with product and engineering · aligned KPI editor, dashboard and report-customize patterns
With product management · engineering · research · content design · design systems · design leadership
“I rebuild the same report every month.”
Every month-end, accountants export QuickBooks reports into Word, PowerPoint or Google Docs, write commentary by hand, and repeat it for every client.
Legacy Management Reports could bundle statements into a PDF, but with fixed templates, limited customization and no place to write. Customers kept the reusable part and did the rest outside QuickBooks.
Why it mattered
The report is the moment the books become advice.
Customers
VOC across Slack, support and research kept surfacing the same three asks: control over data, control over presentation, less rework.
Business
Only 2.5% of QuickBooks customers used legacy Management Reports in the project baseline. Accountants were taking the work elsewhere at the moment they needed to explain their value to clients.
Platform
QuickBooks was moving toward an AI-native, builder-based architecture. Reporting needed an authoring foundation that could carry AI assistance, not another template.
Two people, one document
Accountant Emily
The editor
A ProAdvisor preparing monthly packs for many clients. She builds the report in QuickBooks.
Assemble the evidence
Right statements, right period, right comparisons.
Explain what changed
Commentary she would put her name on.
Deliver on a cadence
Same quality next month, less effort.
Owner James
The reader
He receives a PDF, printout or published link, usually at a review with Emily. He reads the summary first and the tables second; he never needs to open the editor.
That is why the canvas is paginated, print fidelity matters, and publishing stays within reach.
We didn’t research, then design. We kept both running.
Weekly, one fixed slot, Jul–Nov.
Vision
Frame the report lifecycle
Vision to builder
Explore the authoring model
Builder
Refine the editing patterns
Build
Keep learning during delivery
Launch
Deliver the foundation
Post-launch
Carry learning forward
Moderated + unmoderated Follow-Me-Homes, from vision through build.
Two principles shaped the experience.
One report lifecycle:
Create → Build → Collaborate → Publish.

Define the whole. Sequence the release.
I used the vision prototype to get leadership, product and engineering agreeing on the same end state before we argued about November.
North Star report lifecycle
Long-term product model, not a shipped-feature checklist. First-release focus refers to the stage; individual capabilities follow the 2025 release plan.
Create
2025 first-release focus- Start from scratch
- Use a template
Build
2025 first-release focus- Reports and KPIs
- Text and media
- Highlights
- Choose a starting style
- Adjust font, color, and layout
Collaborate
Team review deferred in 2025- Share a working link
- Assign review tasks
- Comment on sections
- Resolve feedback
Publish
2025 first-release focus- Send to stakeholders
- Interactive HTML
- Added to the later roadmap
Invite and review were deferred; individual finalization remained in the first-release sequence. Interactive HTML is shown as a vision capability, not confirmed November scope.
Authoring foundation
Create, compose, style, save, publish & send.
Collaboration & scheduling
Keep the full lifecycle in the product direction.
Agreeing on the whole made it safe to defer parts; collaboration left the release without leaving the product.
Legacy Management Reports solved reuse. It stopped at expression.
Keep the saved report.
Reuse was the thing customers valued; the new experience had to be at least as repeatable.
Open up the inside.
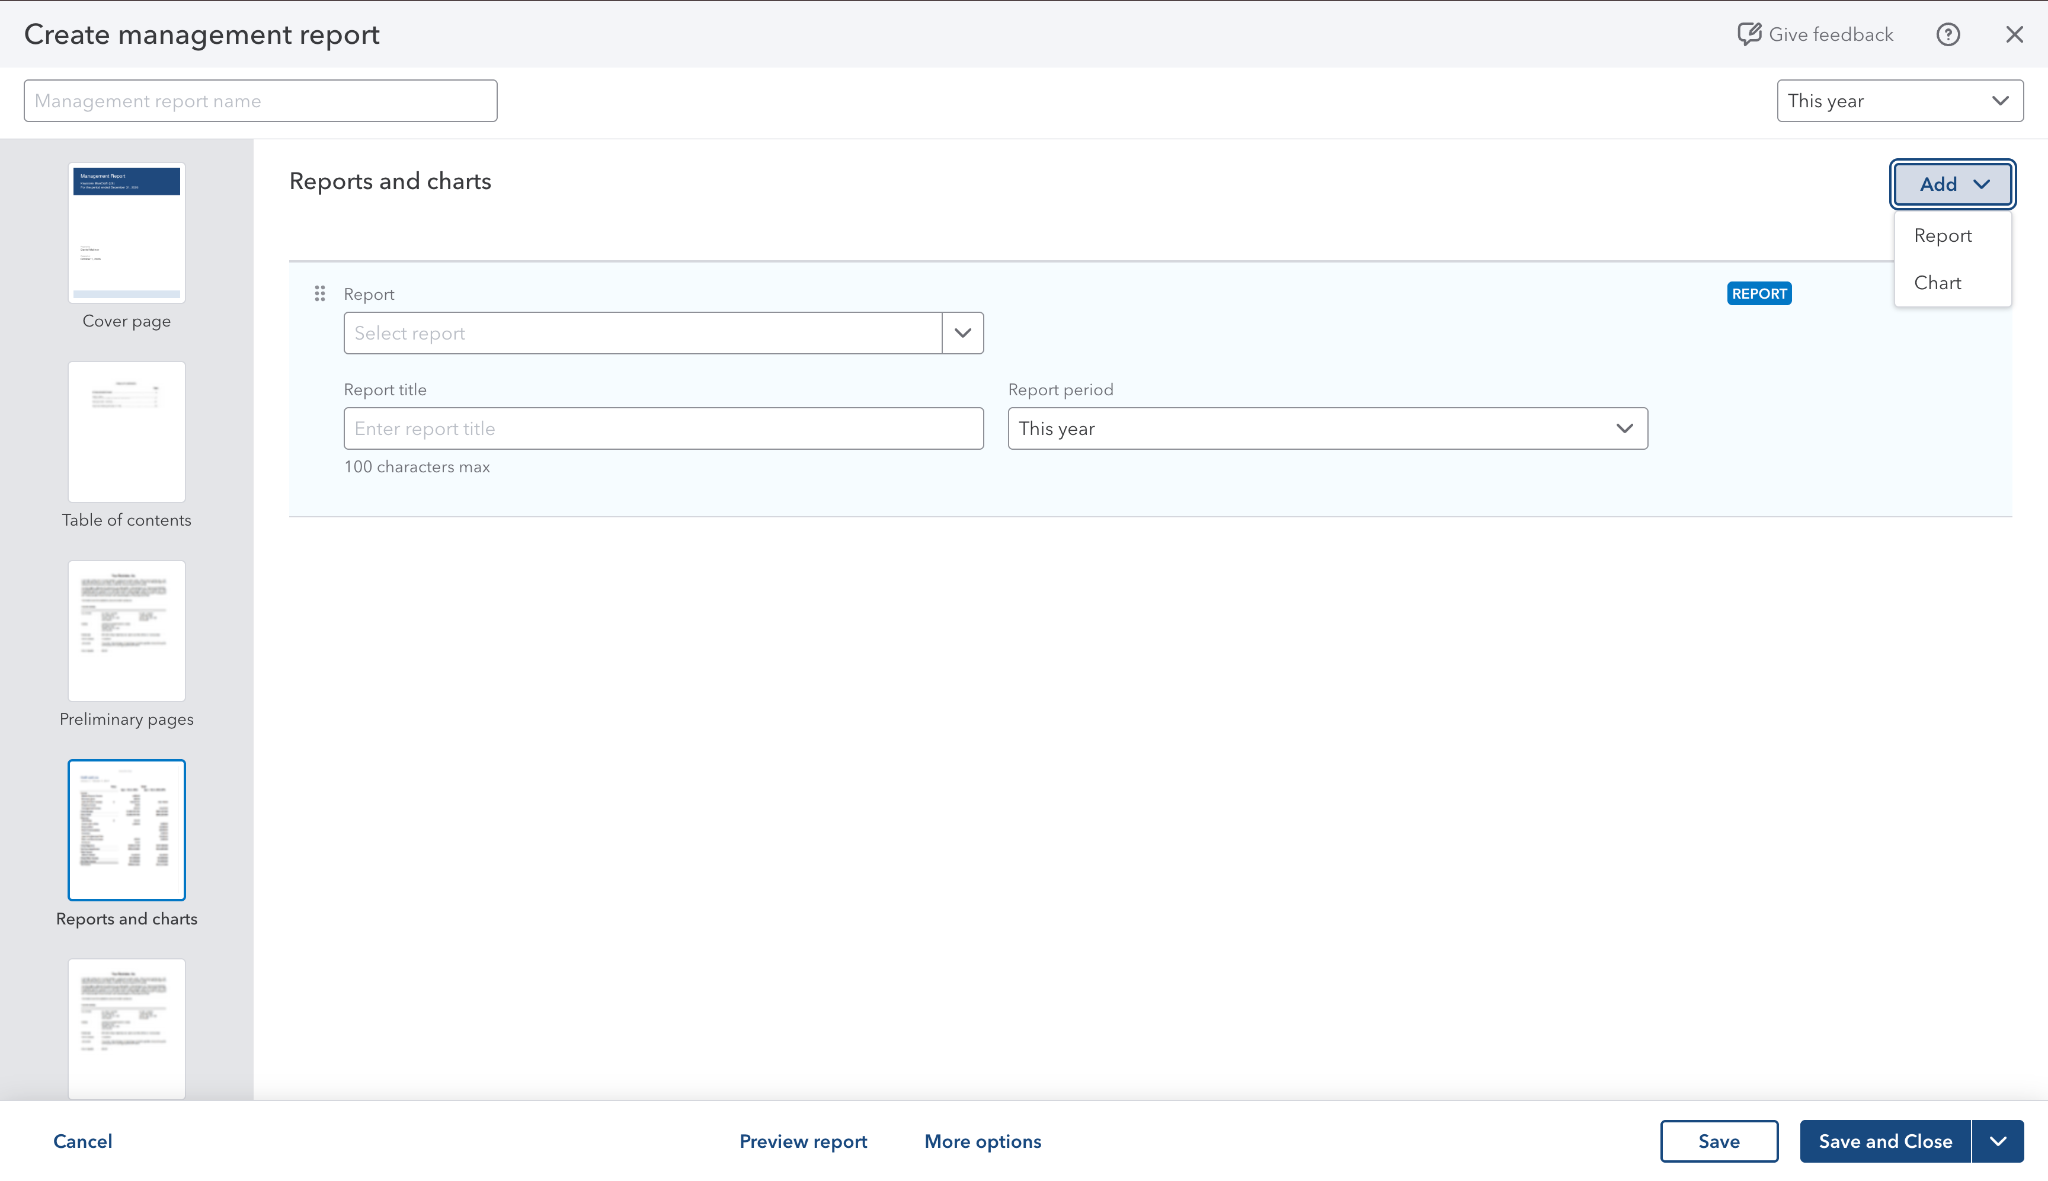
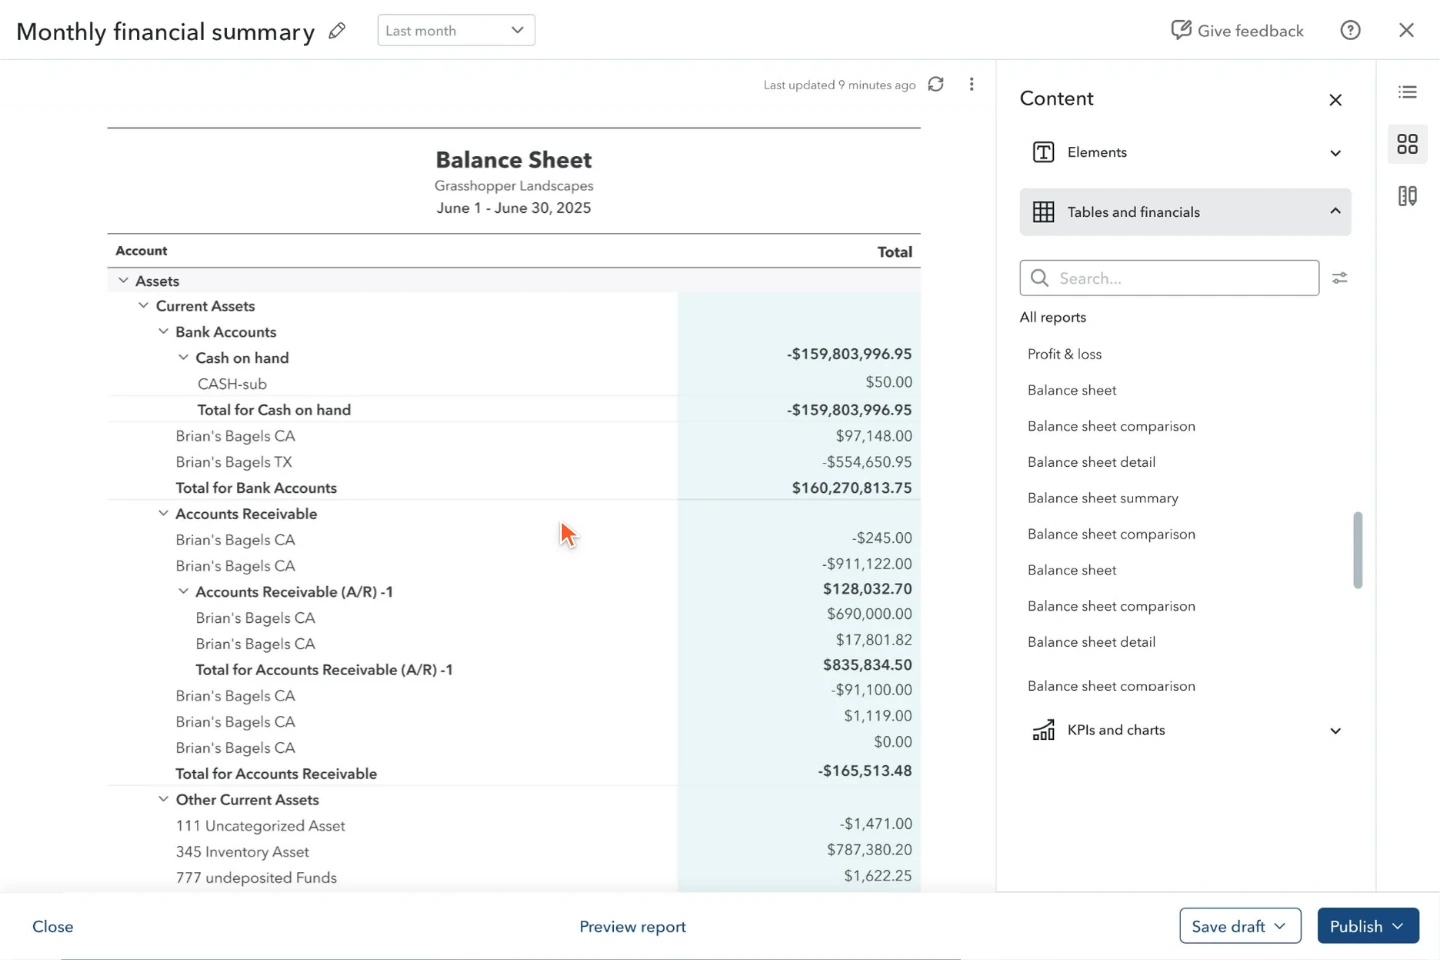
Fixed templates were the ceiling. The new version needed a canvas, not a template picker.
Legacy template

New editor
Design system partnership
QuickBooks had no builder pattern for this experience. Mailchimp offered a reference, but its email-focused builder used a different design language.
I worked closely with the Design System team to create the missing patterns, keep them familiar to QuickBooks users, and add them to the shared system as we built.
Start with what is familiar
QuickBooks foundations
Controls, typography and interaction conventions customers already know.
Create the missing pattern
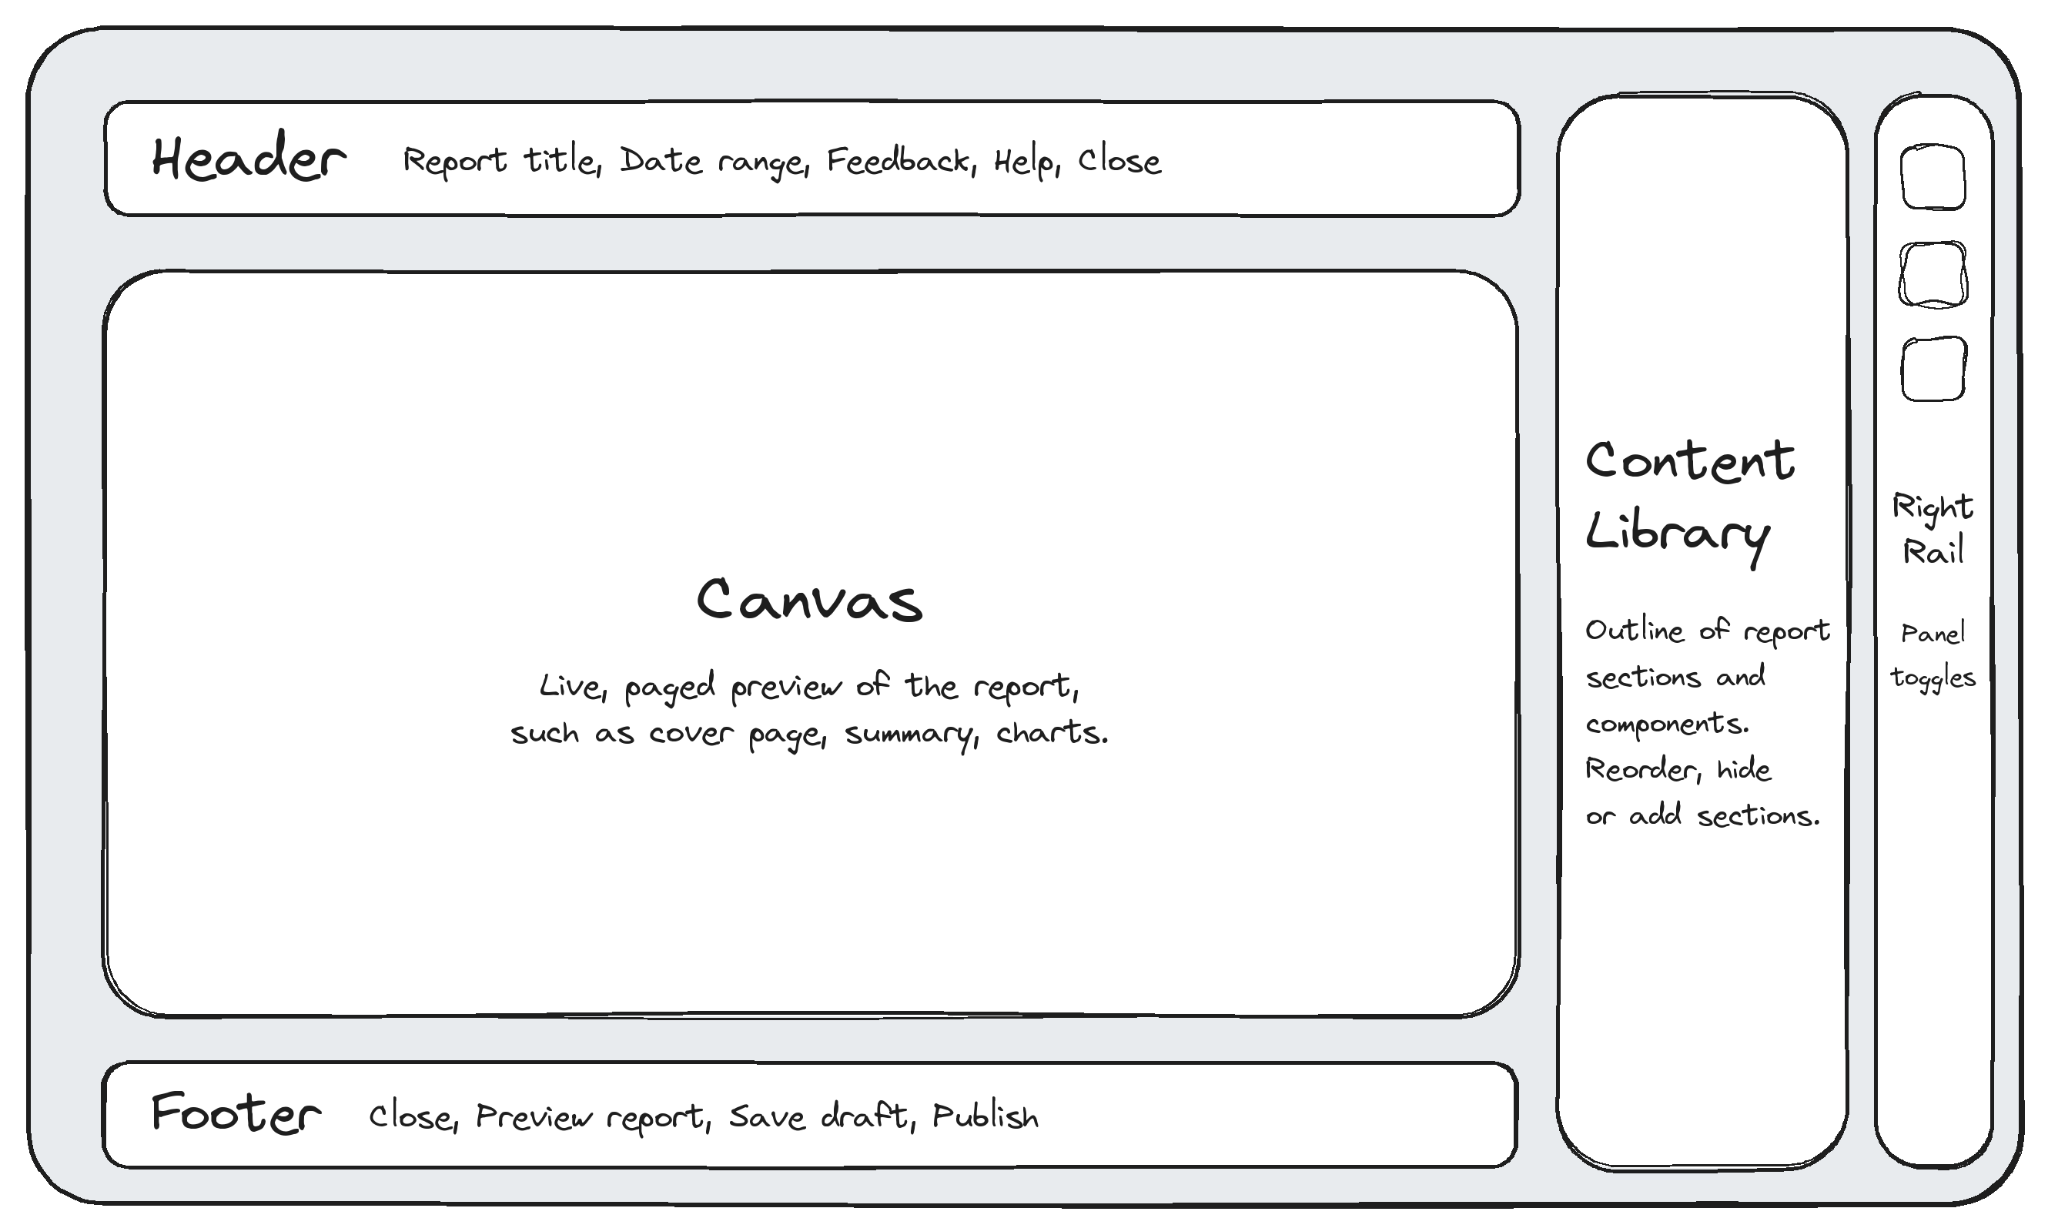
A report builder
A canvas, content library and contextual tools that work as one authoring model.
Build with the system team
Reusable patterns
Develop components and interactions alongside the product, not as one-off screens.
Pattern map; a schematic of the design approach.
Bring numbers and commentary into one editor.
Dashboards answer “what’s happening”; a management report answers “what should we do”. The editor had to feel like writing, with the numbers live inside it.
The report sets the default time period.
Use the report period by default.
Newly inserted reports should use the management report’s period. A saved custom report can be an exception; make that difference explicit instead of silently changing its dates.
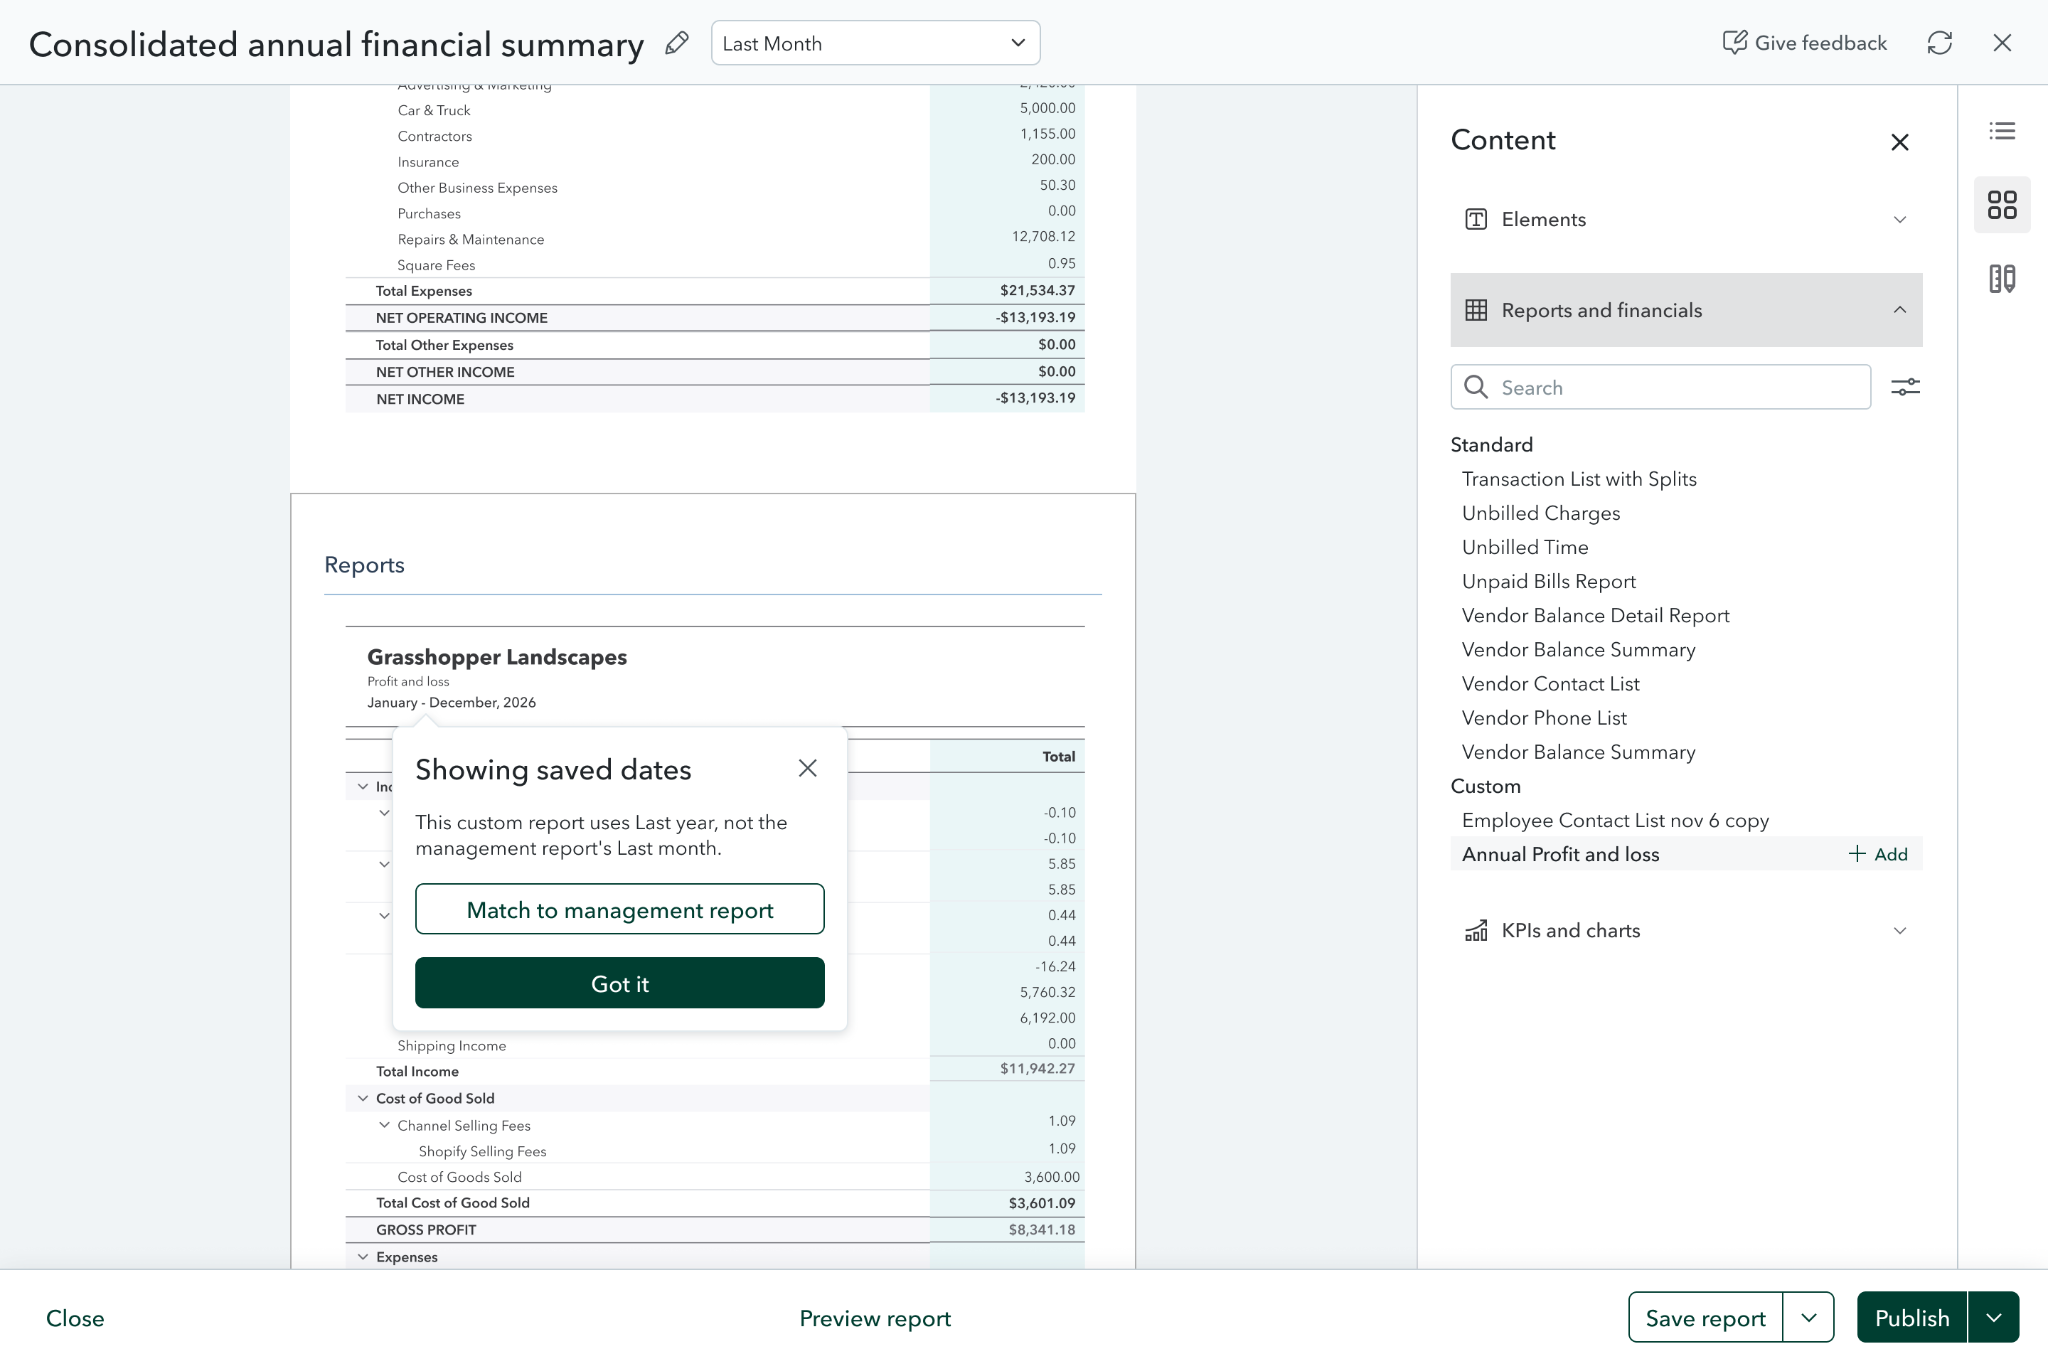
Saved dates, explained after insertion
A contextual message explains why this block uses saved dates and offers “Match to management report”.
It keeps the flow moving, but the person needs to notice the mismatch after the report is already on the canvas.
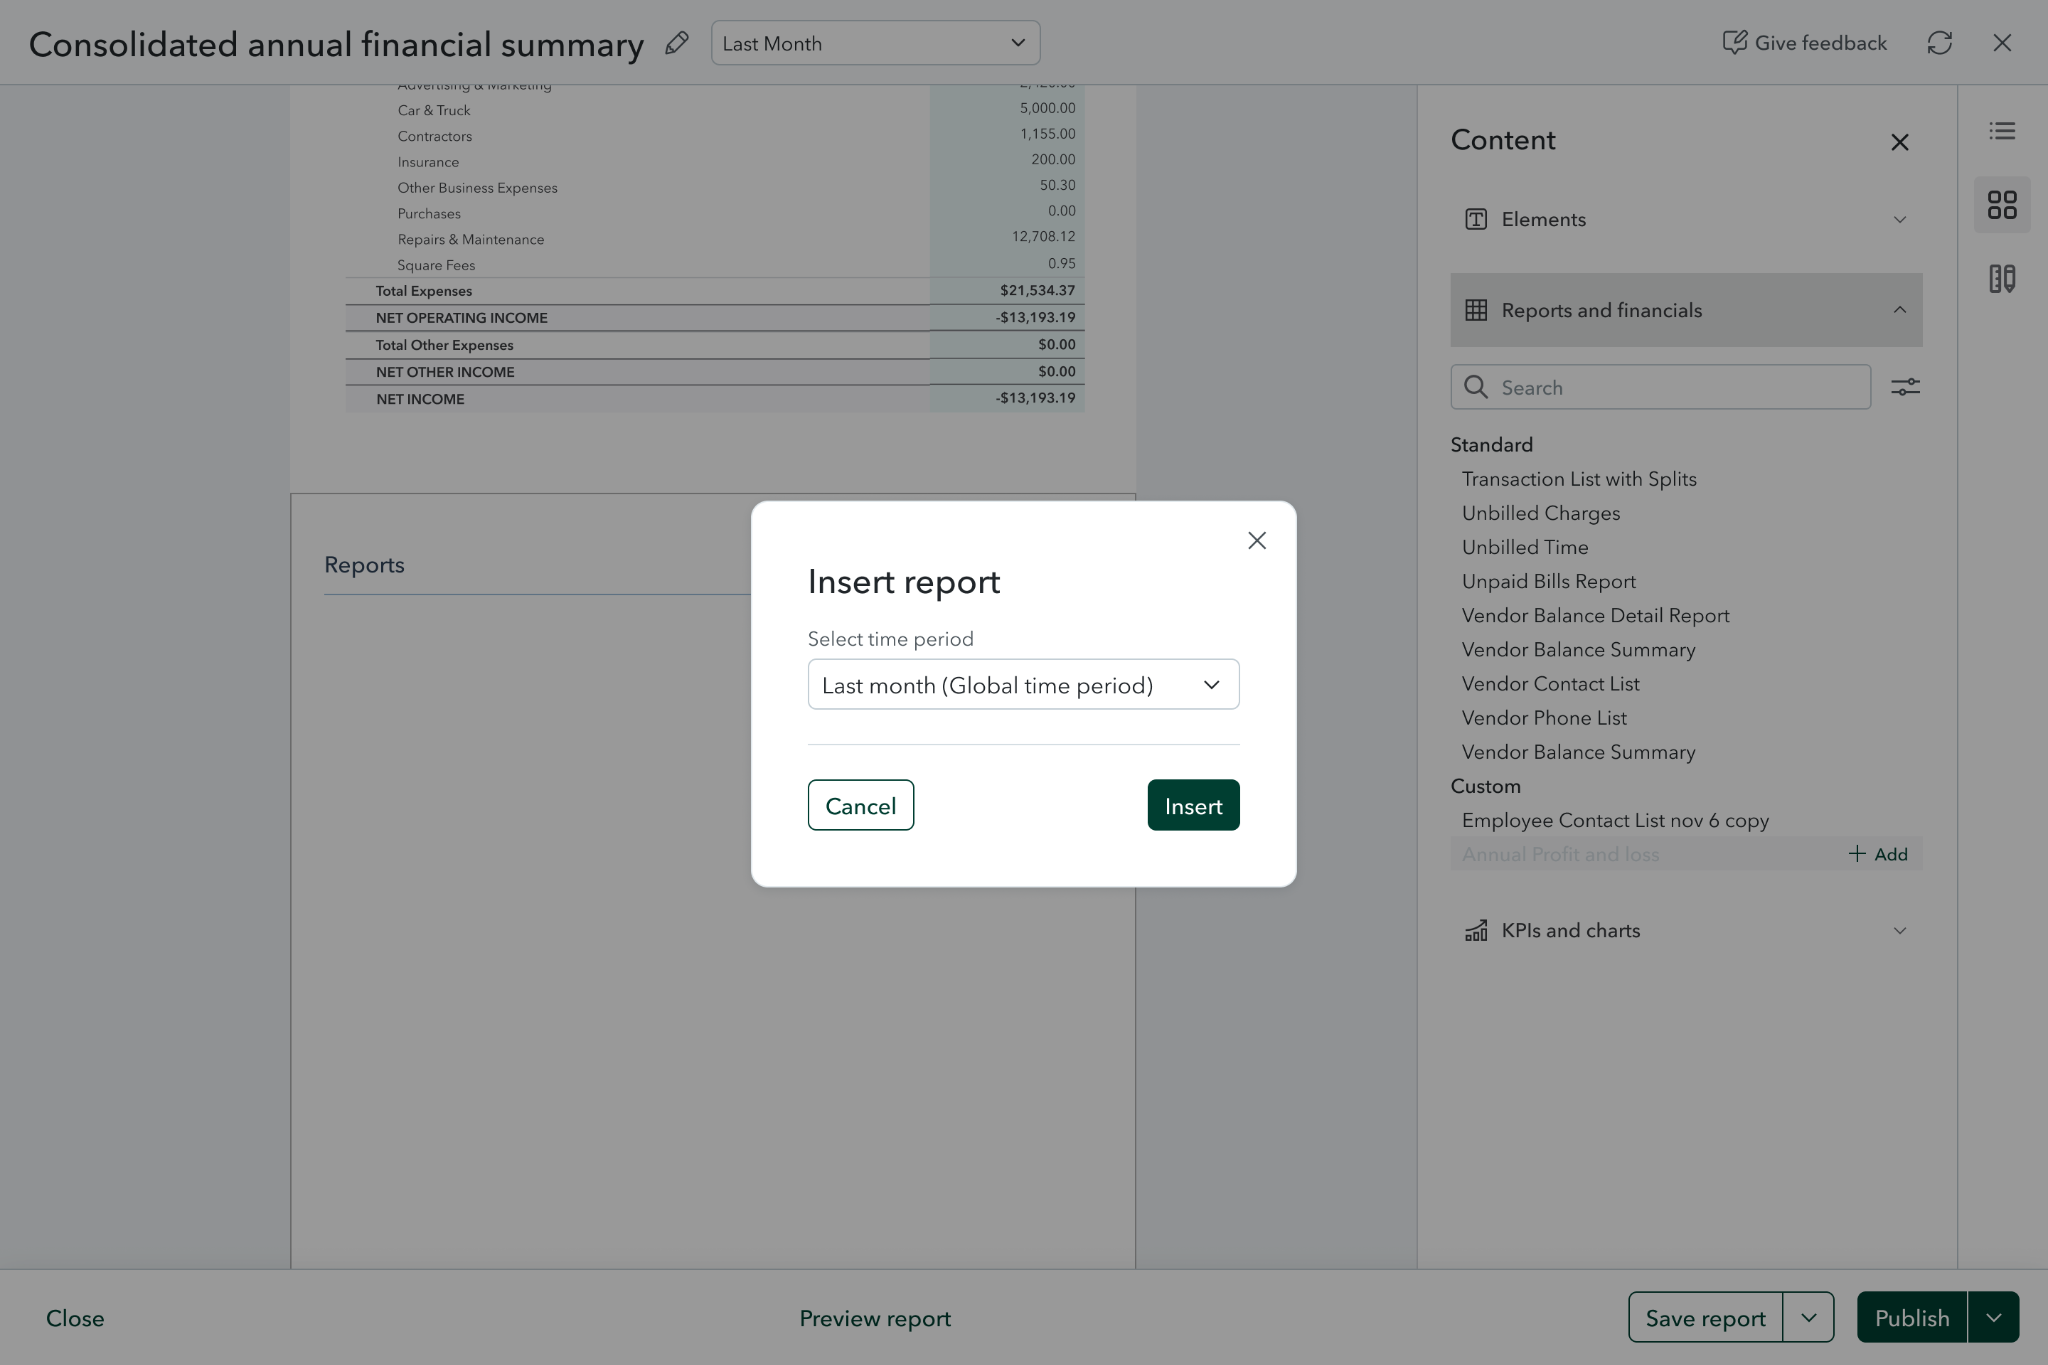
Choose a period while inserting
A compact insert dialog starts with the management report’s global time period.
The default is visible, but asking on every insertion adds a step even when the periods already match.
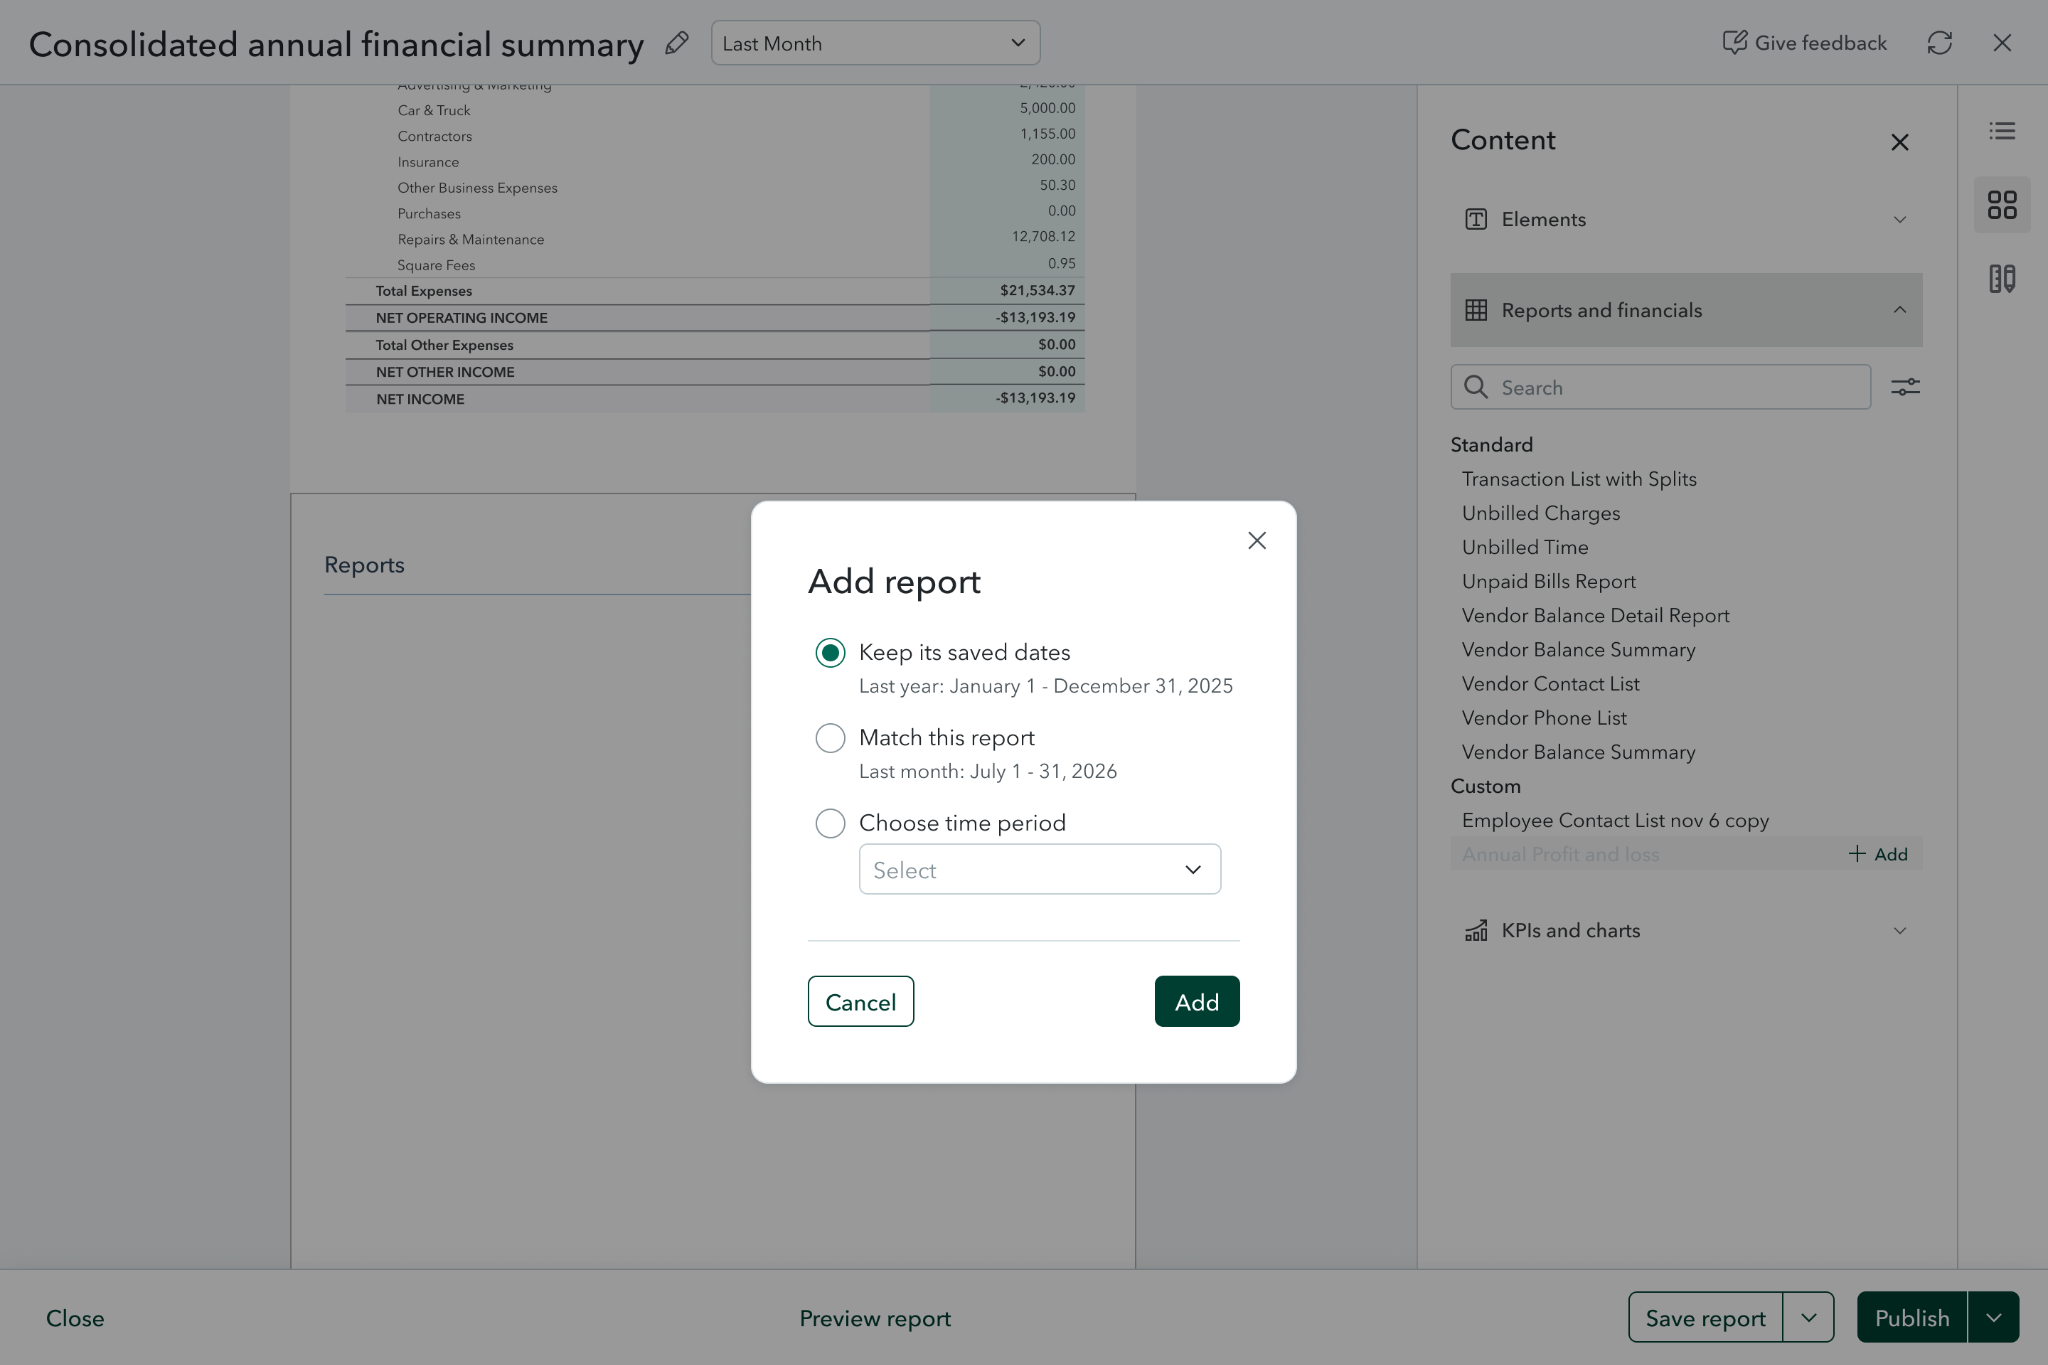
Make the date choices explicit
A dialog separates keeping saved dates, matching the management report and choosing another period.
The distinction is clear. It is most useful when there is a real exception, rather than as a routine interruption.
A sensible default, with room for exceptions.
Keep one reporting period as the default. When saved dates differ, explain the difference and let the author keep those dates or match the report. The rule does the routine work; the author handles the exception.
The final experience
Accountant Emily prepares the monthly financial summary for Owner James.
Start from a template
Emily starts with a ready-made management report rather than a blank page.
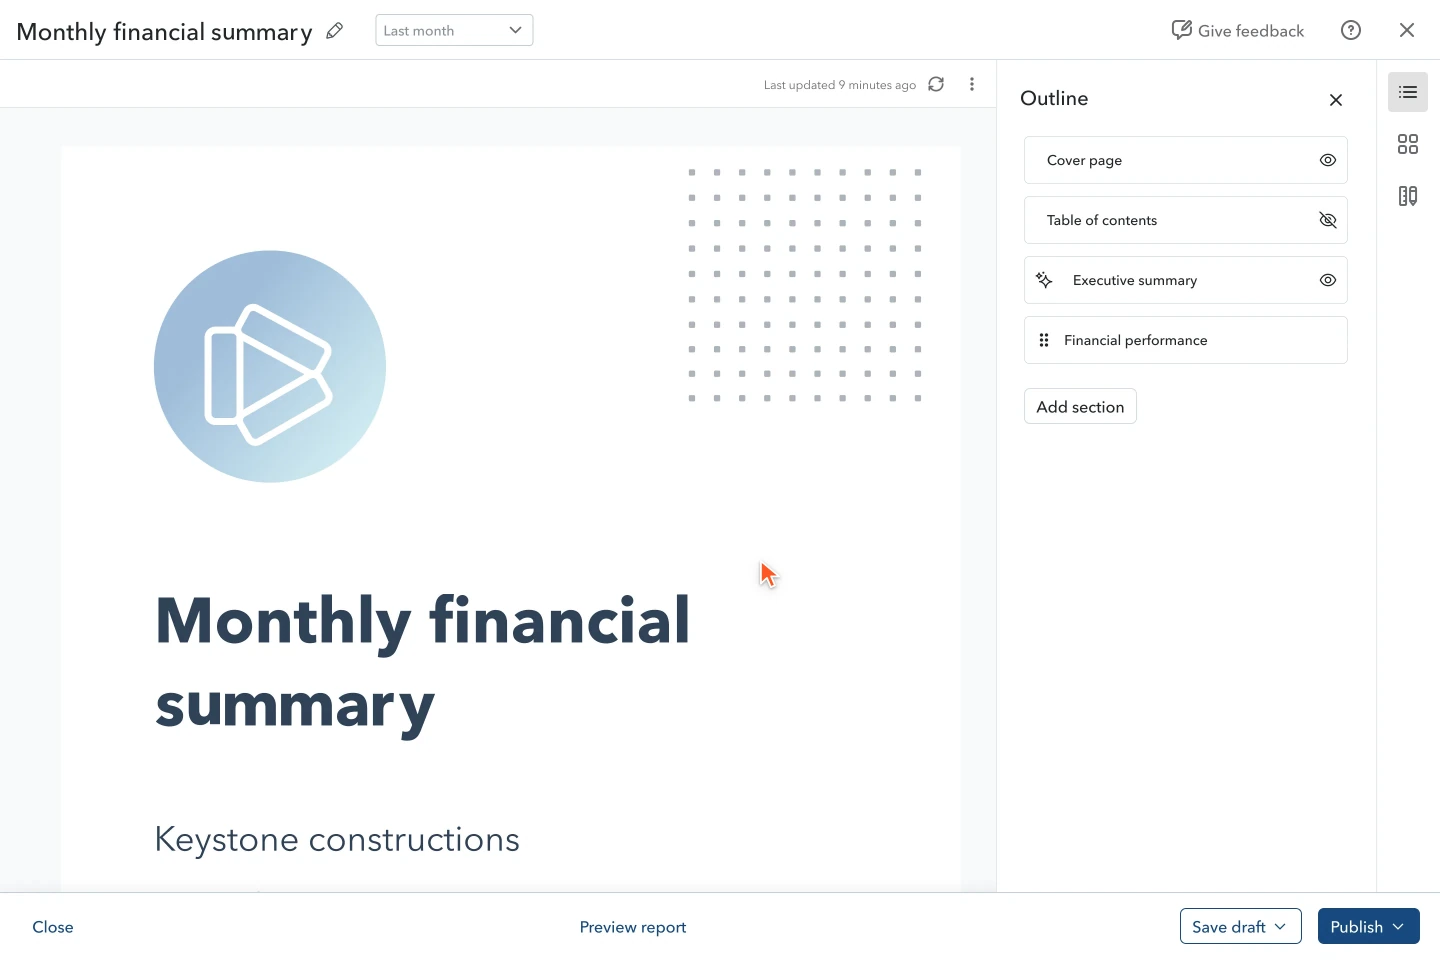
Loading animation...
The final experience
Accountant Emily prepares the monthly financial summary for Owner James.
1 of 7
Start from a template
Emily starts with a ready-made management report rather than a blank page.
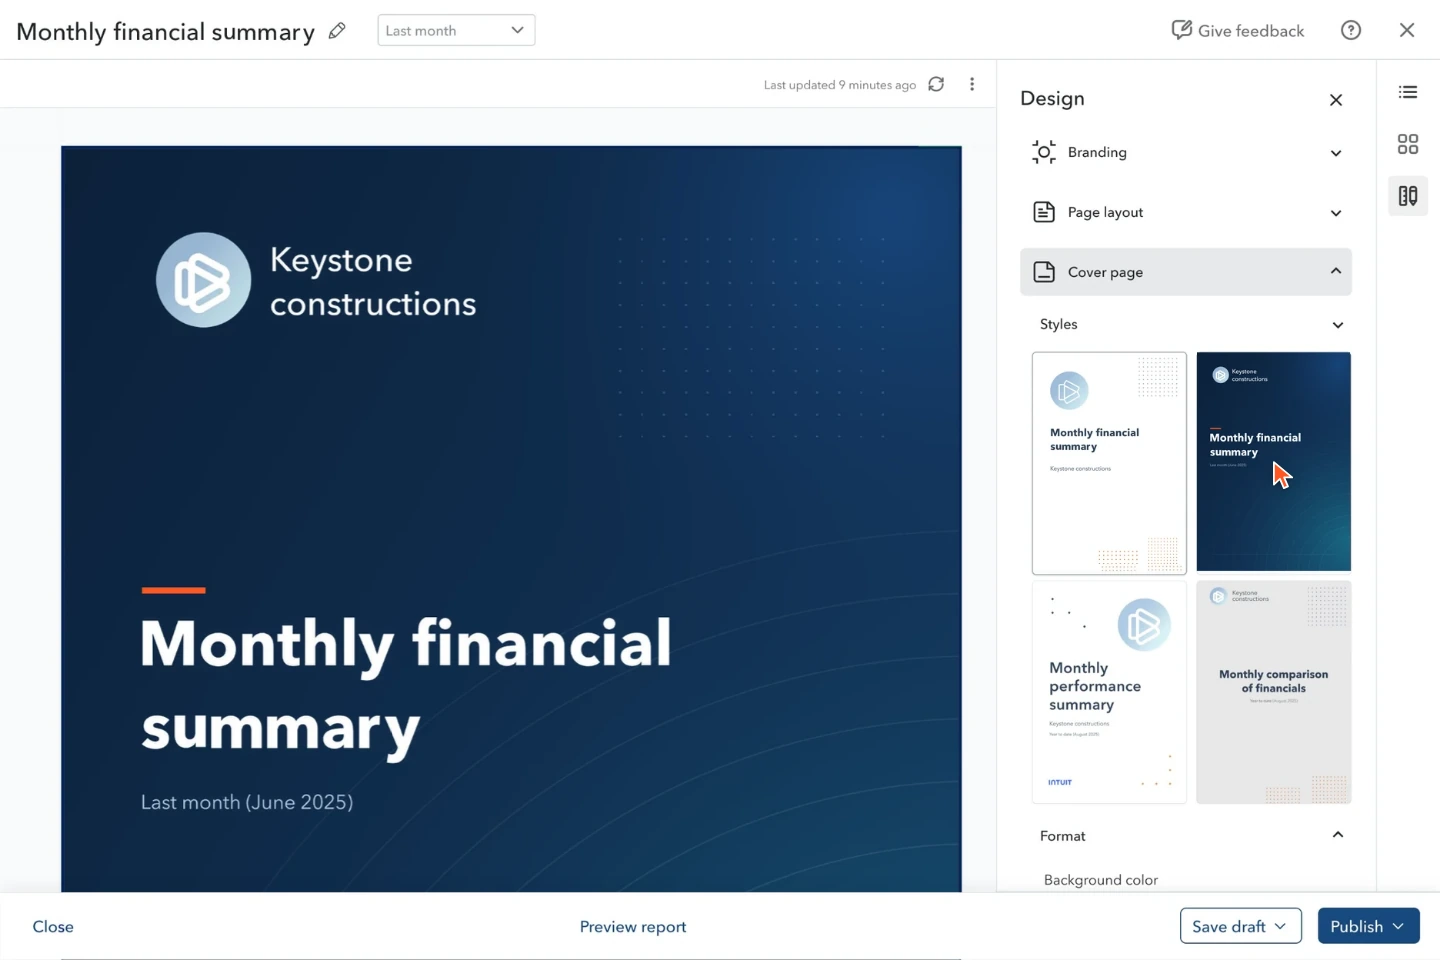
2 of 7
Brand the cover
She chooses a cover style that fits the client’s identity.
3 of 7
Bring in the financials
She adds a balance sheet from the content library; it joins the report and its contents.
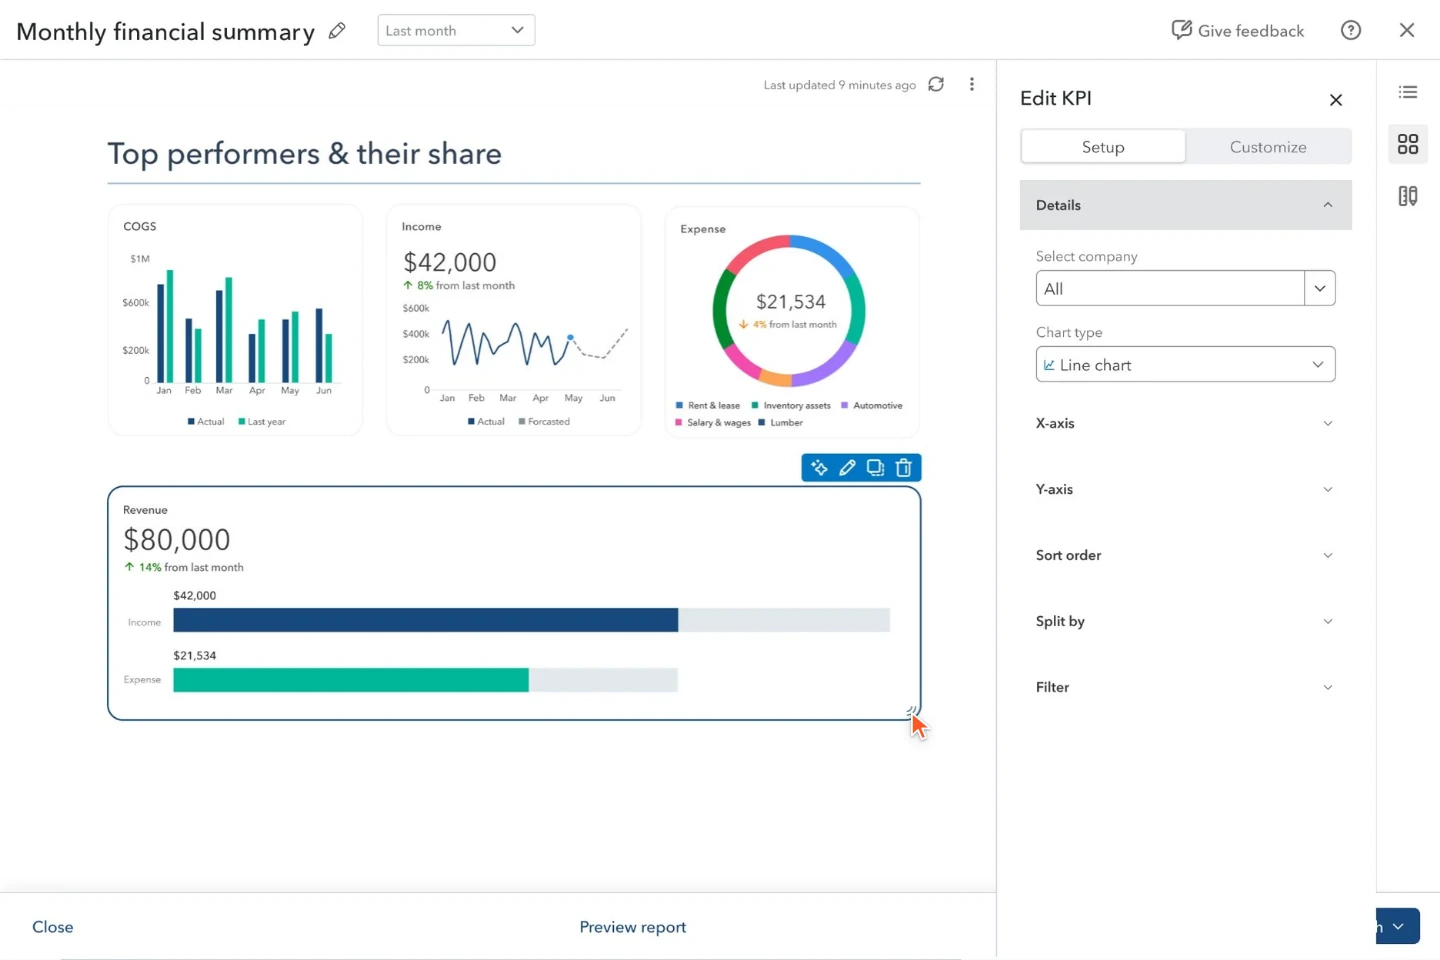
4 of 7
Shape the KPIs
She changes the chart type, adds revenue and resizes the KPI to fit the page.
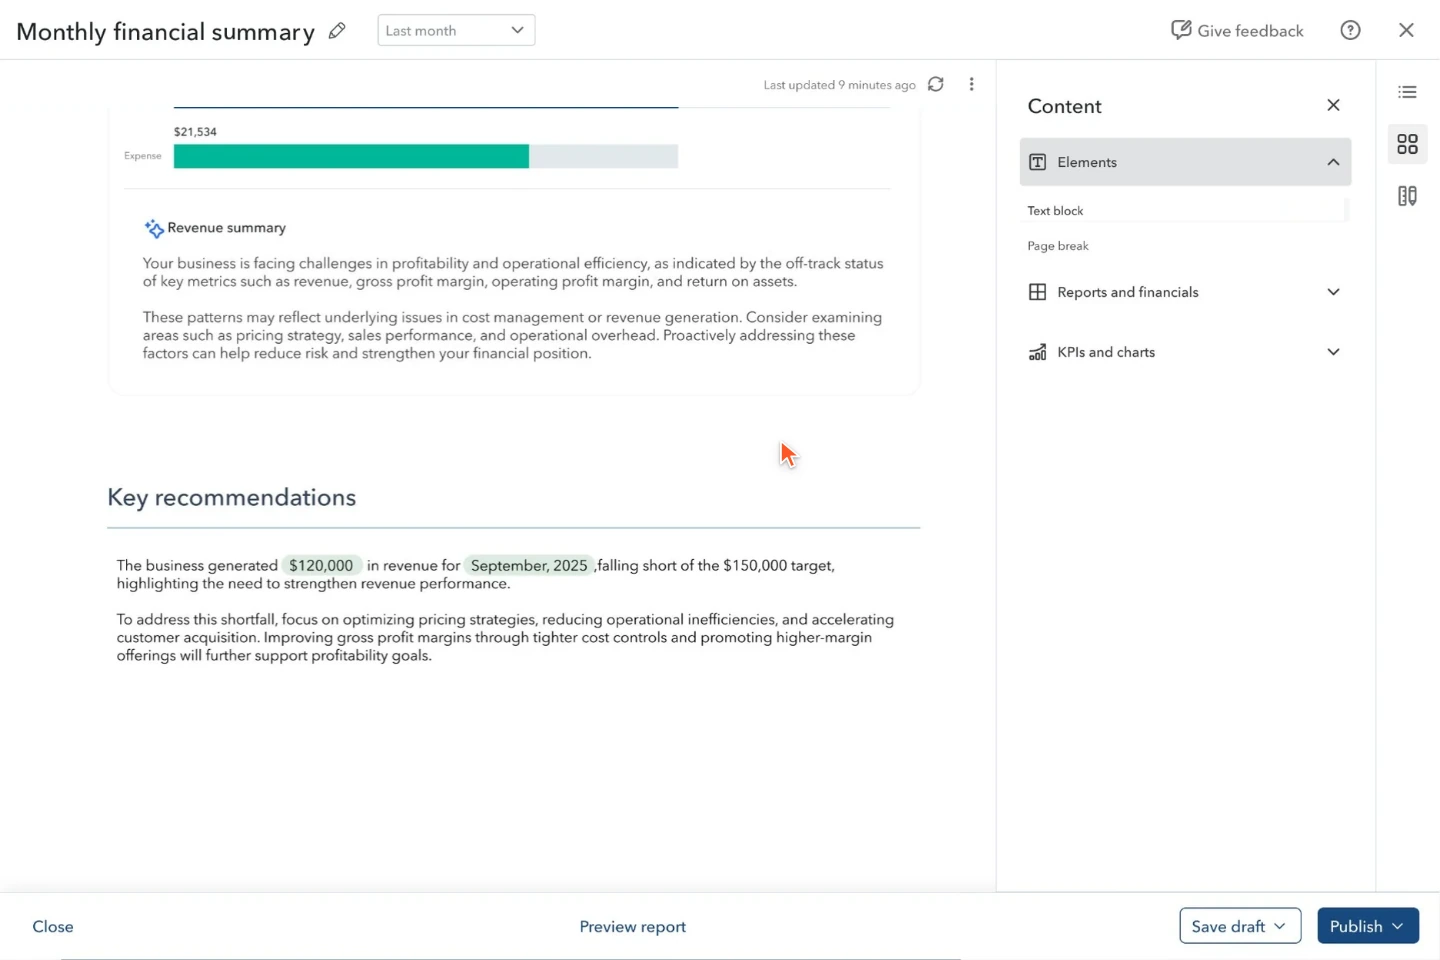
5 of 7
Write with live numbers
She writes commentary using variables that resolve to values for the reporting period.
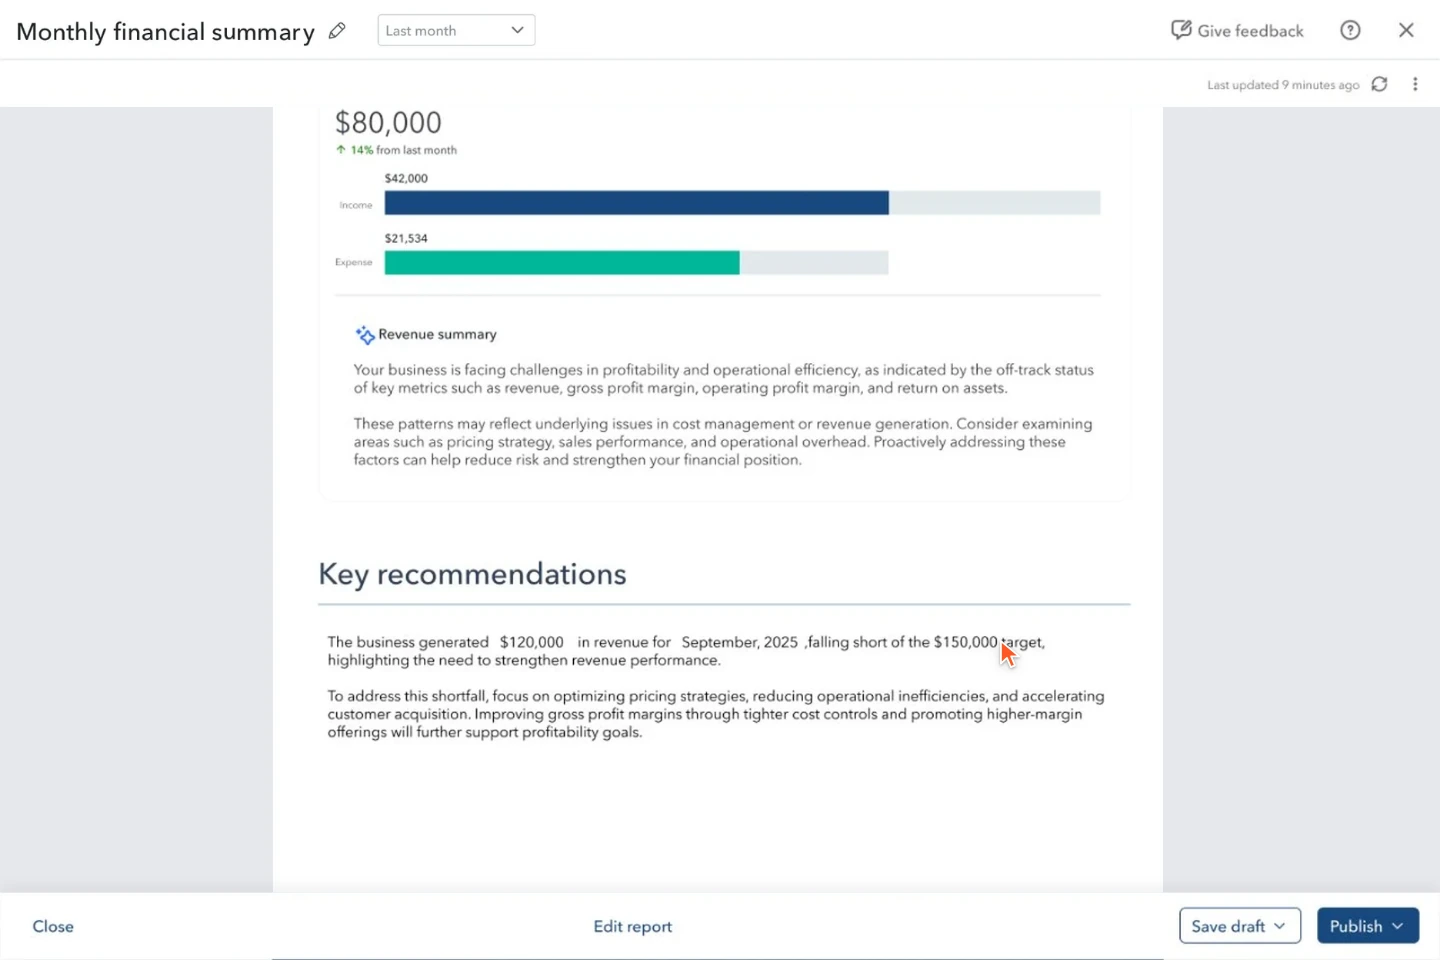
6 of 7
Preview the report
She checks the complete paginated report as the recipient will see it.
7 of 7
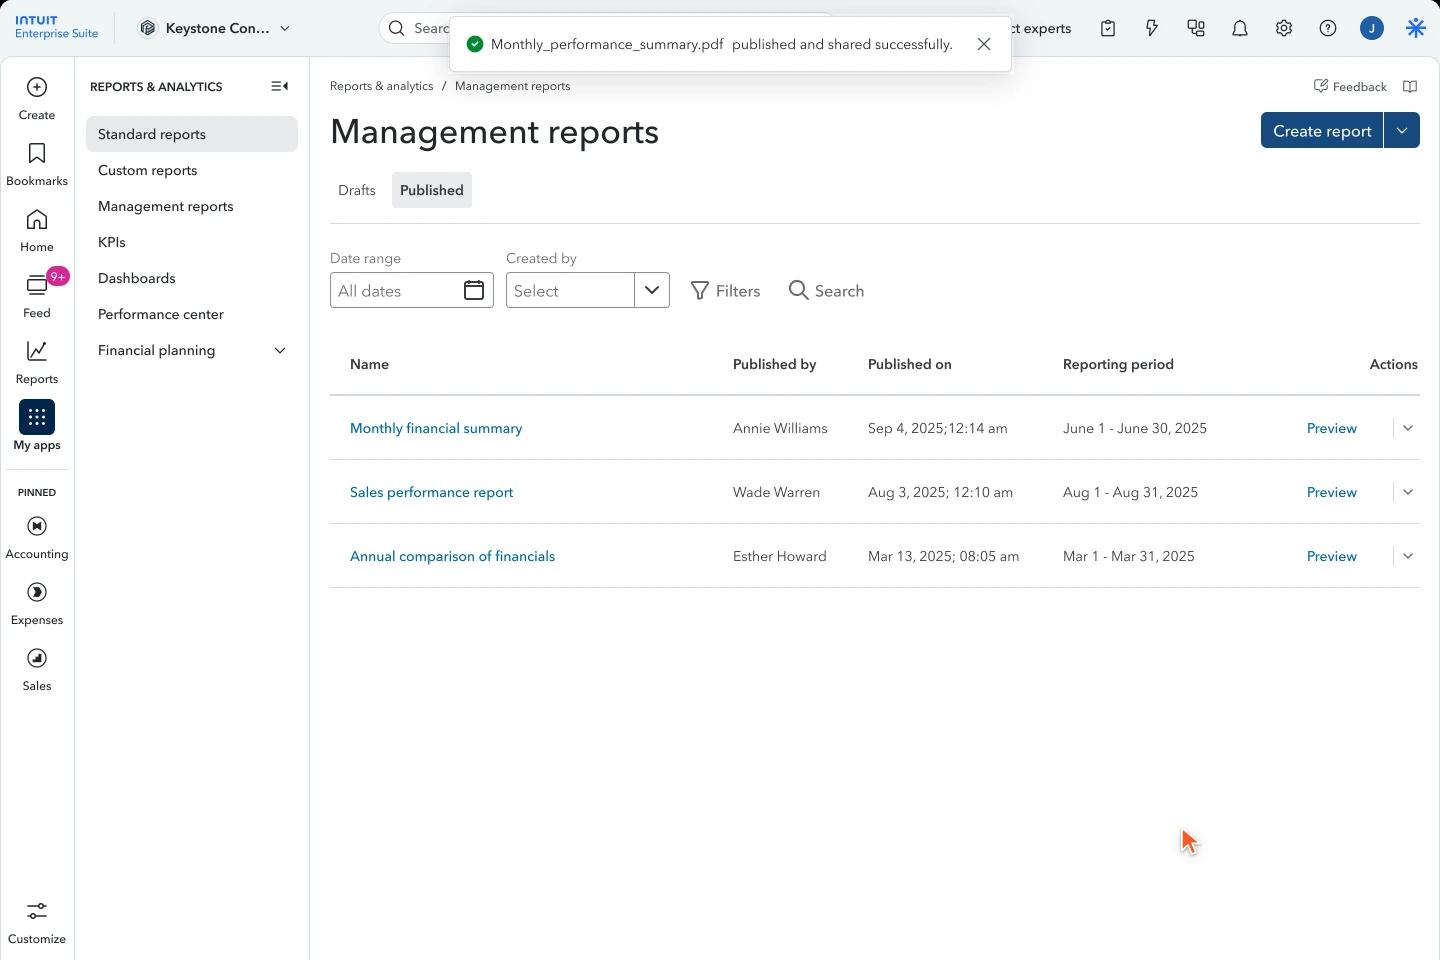
Publish and send
She publishes and sends the PDF to James; he gets a report he can read before their review.
A report is not finished at save. It needs to be ready for the person receiving it.
Before and after
Same company, same year.
Two different reports.
The legacy export on the left, the new Management Report on the right, page by page. Sections the old report never had are left empty on its side.
Scroll inside the reports to compare each section. Select the expand icon to read a page at a larger size.
A fixed November date.
A broad July brief.
Protect the whole workflow.
Create, compose, period logic, style, save, publish and send.
Defer complete capabilities.
Collaboration, scheduling and interactive HTML.
How I kept it coherent
The editor was one surface. The patterns had to work wherever customers met them.
The same editing language.
I worked across Dashboard, the KPI editor and report-customize designs so panels, hero numbers, colour and period controls felt consistent.
92.7%
UI-repository token compliance after scoping; checking the implementation, not just the mockups.
Keep the work visible.
Partner Council and design-share reviews kept decisions open to feedback throughout the build.
Review the words too.
I worked with content design before each research round so labels and explanations were part of what we tested.
What we could have done better
A better builder should not mean starting over.
Legacy users had already invested time in their reports. Seamlessly carrying those reports into the new editor would have reduced the effort of making the switch.
We could not deliver that migration because the two experiences used different architectures. Translating an existing report into the new builder was an engineering challenge, leaving customers to recreate their setup.
Bring their work with them.
Treat migration as part of onboarding, not a separate task for the customer.
Structure, choices and repeated work
Preserve the setup before asking for new work
The next step is to work with engineering on a reliable migration path, making unsupported elements clear and giving customers a way to review the result.
What design influenced.
With the Design System team, I helped add the new builder patterns to QuickBooks’ design system.
One authoring model
A document editor became the shape of reporting, not a template picker.
The period rule
Inherit-by-default now governs every inserted report.
Reusable builder patterns
New components and interactions were developed with the Design System team, alongside the report editor.
A roadmap in the lifecycle
Collaboration and scheduling are sequenced, not dropped.